|
| |
Chapter 12 The Reactis Coverage-Report Browser
The Coverage-Report Browser enables users to view detailed coverage
information related to testing and to export the reports in HTML
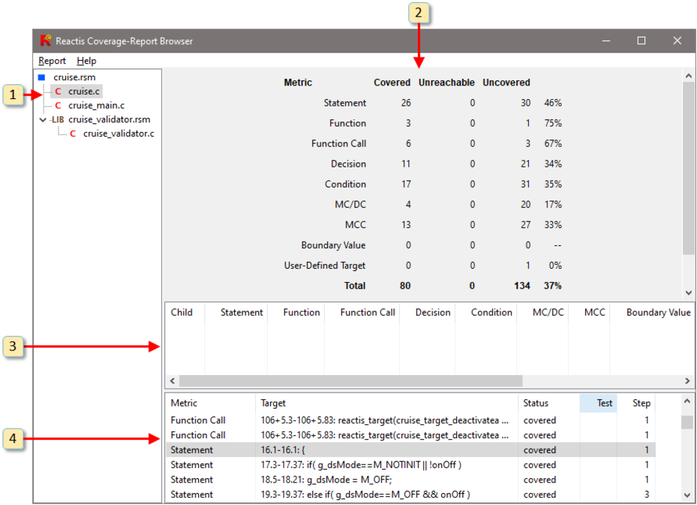
format for viewing and printing. Figure 12.1 contains
an annotated screen shot of the Coverage-Report Browser. The title bar
includes information describing the test suite, tests, and test steps
that were exercised before computing the coverage information. Here,
the report describes coverage attained after executing steps 1 through
100 of test 12 in test suite cruise.rst. When a report
reflects the coverage attained by executing an entire test suite, only
the test suite name appears in the title bar.
12.1 Labeled Window Items
- The hierarchy panel works much as the hierarchy panel does in
the top-level Reactis window. Clicking the
 to the left
of a project component name displays the subcomponents of the item.
Clicking on a
to the left
of a project component name displays the subcomponents of the item.
Clicking on a .cor.rsmfile causes coverage information for the component to be displayed in the panels to the right. Double-clicking on a name causes the source code to be displayed in the main panel of the top-level window. - This panel displays summary coverage statistics for the item currently selected in the hierarchy panel.
- This panel shows coverage information for each subcomponent of an
.rsm file selected in the hierarchy panel. Since C files have no
subconponents, this panel is blank when a C file is selected in the
hierarchy panel. The information is presented as a matrix and
includes a row for each component. The first column includes the names
of the components, while each subsequent column includes statistics
for one of the coverage metrics tracked by Reactis for C.
Double-clicking on a row selects the component on that row for display
in the Coverage-Report Browser.
The rows of the table may be sorted based on the values of any column. To cause the values in a particular column to order the rows, simply click on the header of the column. Clicking once sorts in increasing order of the column entries, while clicking a second time sorts in decreasing order.
- This panel gives detailed information for each coverage target
in the item currently selected in the hierarchy panel. If an
.rsm file is currently selected in the hierarchy panel, then this
panel is empty, since an .rsm file does not directly contain
coverage targets. If a C file is selected in the hierarchy panel,
then this panel displays a list of coverage targets in the C file.
Each row in the list displays whether or not a target has
been covered. If it has been covered, the test and step in which it
was first exercised are also displayed. Double clicking on a row
causes the selected target to be highlighted in yellow in the main
panel of the top-level window.
Note that decision, condition, MC/DC targets are grouped into a single row. The MCC targets for a decision are also grouped into a row (distinct from the decision, condition, MC/DC row). The status columns for these aggregate rows display covered when all targets in the associated group are covered. Right clicking on such an entry will activate a pop-up menu that includes the menu item Show Details. When this menu item is selected a dialog conveying coverage information similar to that shown in Figure 8.14 will appear. See Section 8.6.2 for a description of this dialog.
The rows of the table may be sorted based on the values of any column. To cause the values in a particular column to order the rows, the user simply clicks on the header of the column. Clicking once sorts in increasing order of the column entries, while clicking a second time sorts in decreasing order.
12.2 Menus
- Report menu.
- The Report menu contains the following entries.
- Help menu.
- The Help menu contains the following entries.
- Contents.
- Go to the table of contents in the in-tool documentation.
- Index.
- Go to the index in the in-tool documentation.
- Coverage-Report Browser.
- Display Coverage-Report Browser help.
12.3 Exporting Coverage Reports
The Coverage-Report Browser includes a facility that enables you to export coverage reports in HTML format. The resulting files may be viewed and printed using facilities in a web browser. The dialog shown in Figure 12.2 is invoked by selecting the Report -> Export... menu item from the Coverage-Report Browser menu bar. Coverage details in the exported reports are organized so that each component (.rsm file or C file) of the project has a section in the report; a component’s section includes coverage information for the targets in that component.
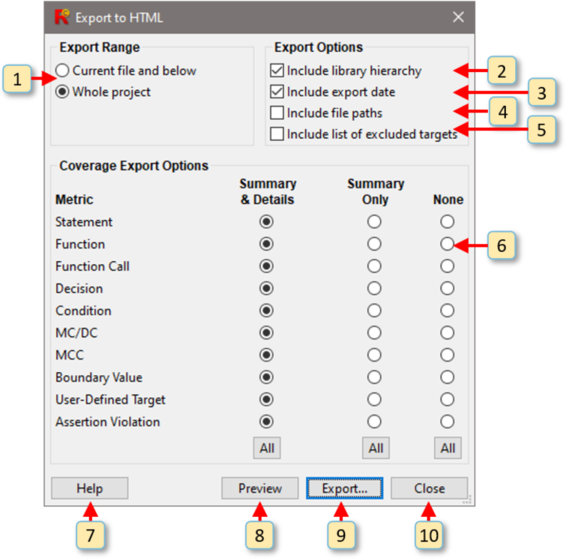
The labeled items in the dialog are used as follows.
- The radio button selected from this group specifies the portion of the project which will be included in the exported report.
- When this check box is selected, a table of contents containing a link to each section will be included at the top the exported report.
- When this check box is selected, the date the report was generated is included at the top of the report.
- When this check box is selected, the full filesystem paths to the relevant .rsm file file and .rst file are included at the top of the report. If the report conveys statistics after tests from a test suite have been executed, then the .rst file named is the file in which these tests reside.
- When this check box is selected, a list of targets which were excluded from coverage (see Section 7.12) will be included in the report.
- This section lets you configure which coverage metrics will be included
in the generated report. Each metric has a row with radio buttons to
select from three options for the metric:
- Summary & Details
- Display detailed information about the test and step in which each target in the metric was first covered. Also include summary statistics for the metrics in all summary tables.
- Summary Only
- Only include the metric in summary tables. Do not include details about the test and step in which targets from the metric are first covered.
- None
- Do not include the metric in any part of the report.
- Click this button to display in-tool help for the coverage export.
- Click this button to preview the report to be exported.
- Click this button to export the report. A file selection dialog will appear to allow you to name the file where the report should be written.
- Click this button to abort report generation.
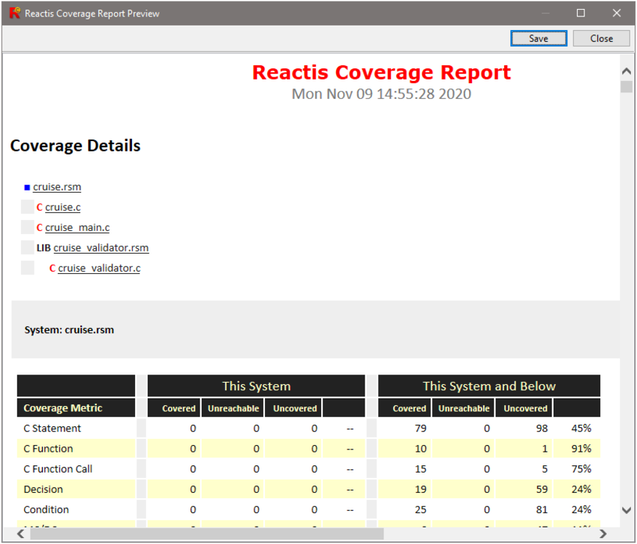
12.4 Coverage Report Contents
Based on the selections in the Export to HTML dialog, a report will be generated with different elements. An example report is shown in Figure 12.3. For each .rsm and .c file, the report will include a summary section (coverage statistics for the file) and details section (detailed information about the coverage of each target in the file). The Export to HTML dialog lets you specify which coverage metrics should be included in the summary and detail sections.
When using the Reactis for C Plugin or the Reactis for EML Plugin, Reactis tracks coverage targets within the C or EML code incorporated into a model. In this case, HTML coverage reports will include source code annotated to convey coverage information as shown in Figure 12.4. Lines with uncovered statements are printed in red. A yellow status column to the left of the code and to the right of the line numbers displays additional coverage information.
The left portion of the status column gives the coverage status of each
statement in the line. Each statement in the line will have an indicator
that is either a red S (meaning uncovered statement) or
test/step giving the test and step in which the statement was first
exercised. If a line contains more than one statement, then a list of
indicators will be separated by commas. A blue indicator S:excluded
means the statement has been excluded from coverage tracking.
The right portion of the status column gives the coverage status for the
decision-related targets in the line. The aggregate indicator takes the form
D:xxx. The D symbol is used to convey that the information
relates to a decision. The first position after the colon represents
decision coverage, the second condition coverage, and the third MC/DC.
Each x can be:
- -
- One or more target is not covered.
- +
- All targets are covered.
- e
- One or more targets are excluded and all non-excluded targets are covered.
Each aggregate decision indicator is a hyperlink that, when clicked, takes you to the details table for the decision.
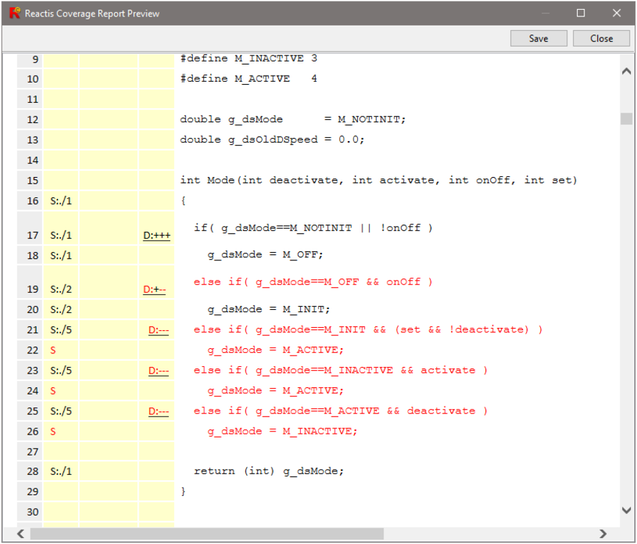
The indicators in Figure 12.4 can be interpreted as follows:
- Line 46
-
D:---means at least one decision, one condition, and one MC/DC target remain uncovered. - Line 50
-
D:+++means all decision, condition and MC/DC targets have been covered. - Line 52
-
D:+--means both decision targets have been covered, but at least one condition and one MC/DC target remain uncovered.